Hello! When you're designing systems, you often come across the term 'SysML'. At first, the unfamiliar terms and complicated-looking diagrams can be a bit of a headache. I've been there too. But once you get to know it, SysML is a really powerful tool that helps you clearly express complex systems and ensures the whole team is on the same page. 😊
Today, join me for a fun and easy exploration of the 9 core diagrams that make up SysML. By the time you finish this article, SysML won't seem so difficult anymore!
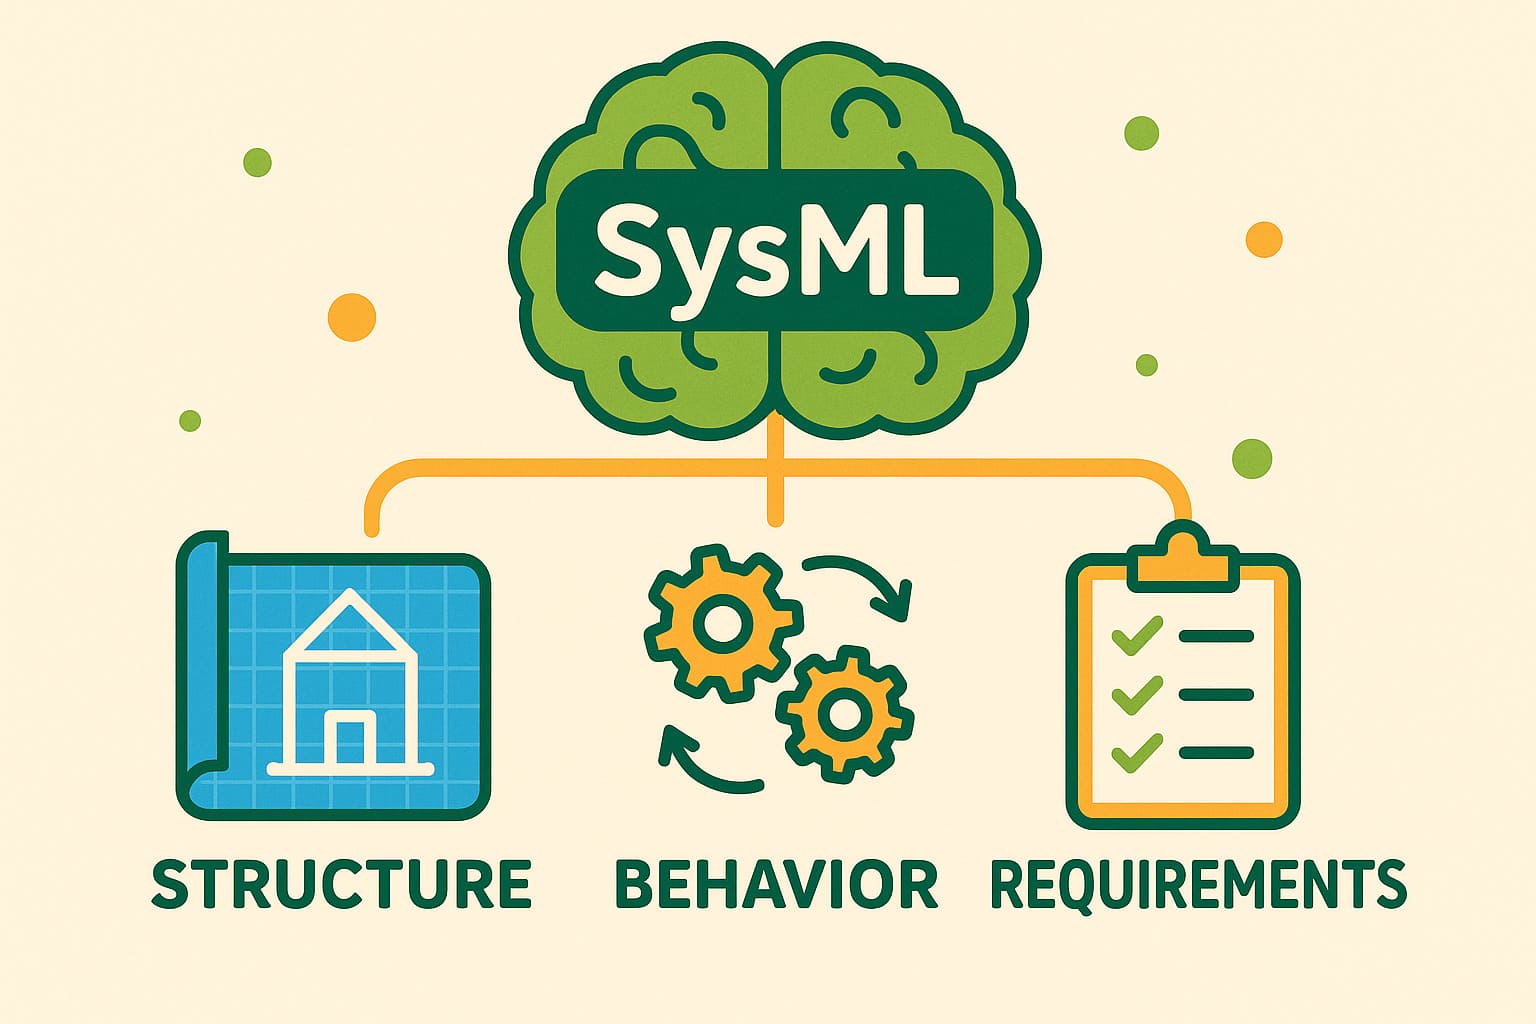
The Pillars of SysML: Grasping Structure, Behavior, and Requirements 🏛️
SysML isn't just a drawing tool; it's a language for systematically analyzing and designing systems. It's primarily composed of three main pillars: Structure, Behavior, and Requirements. Additionally, the Parametric Diagram is used to express the system's constraints.
SysML is an extension of the Unified Modeling Language (UML), which is tailored for systems engineering. That's why many diagrams look similar to UML, but SysML places a greater emphasis on representing the entire system.

1. The System's Skeleton: Structural Diagrams 🏗️
These diagrams show what elements a system is made of and how they are connected. Like a building's blueprint, they help in understanding the overall structure of the system.
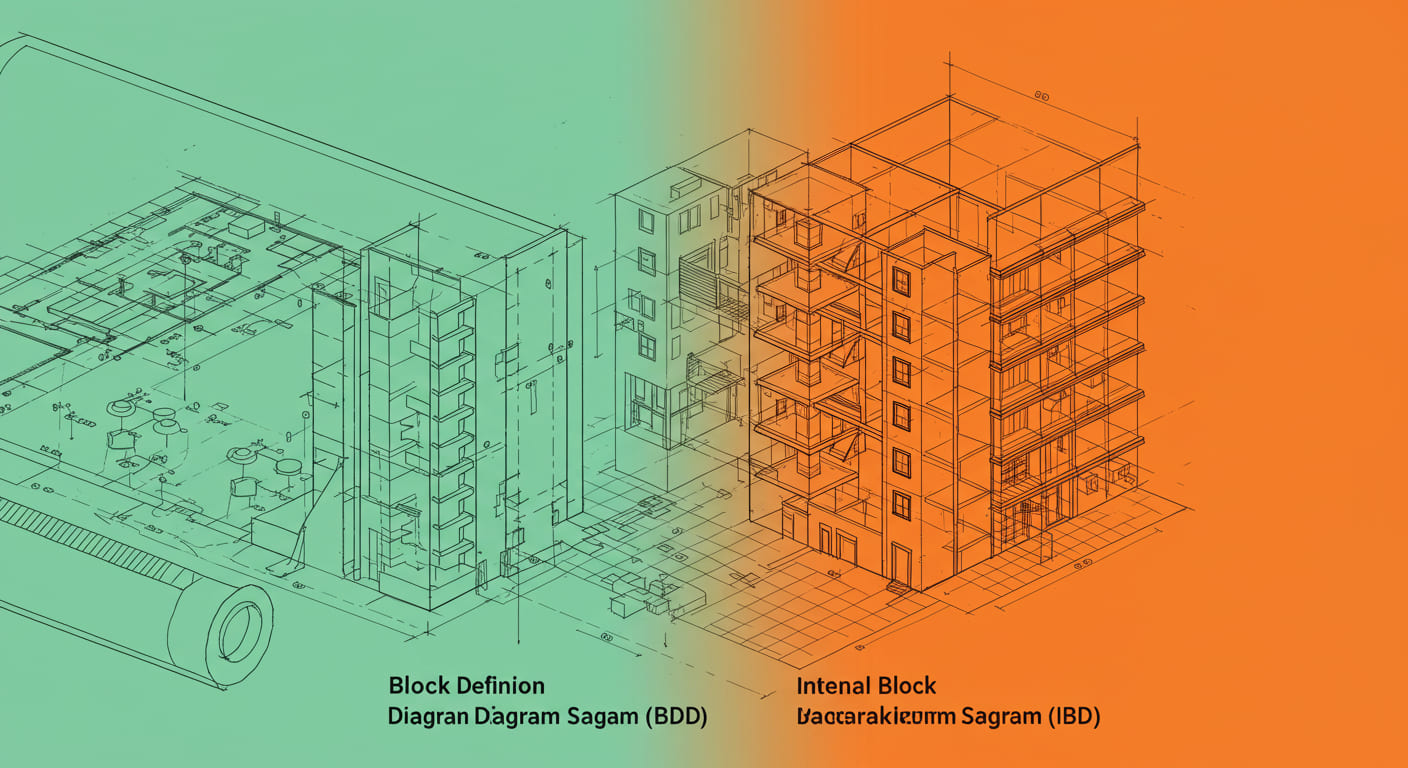
- Block Definition Diagram (BDD): Defines the main blocks of the system (hardware, software, people, etc.) and their relationships. It shows the highest-level structure of the system.
- Internal Block Diagram (IBD): This diagram provides a more detailed look inside a specific block. It shows how the internal parts and connectors within the block interact.
- Package Diagram: As a model becomes complex, related elements are grouped into packages. This diagram shows the relationships between these packages, helping to organize the model and make it easier to understand.
If a BDD is close to the 'definition' of a system, an IBD focuses on showing how that defined block is actually 'used'. A BDD expresses general relationships between blocks, while an IBD shows specific connections between parts.
2. The System's Movement: Behavioral Diagrams 🏃♂️
These diagrams express how a system behaves over time and interacts with the outside world. They are essential for understanding the dynamic aspects of the system.
| Diagram Type | Description |
|---|---|
| Activity Diagram | Shows the flow of work or processes in sequence. Models the system's functionality through inputs, outputs, and control flows. |
| Sequence Diagram | Displays messages exchanged between objects (blocks) in chronological order. Useful for understanding system interactions scenario by scenario. |
| State Machine Diagram | Shows how an object's state changes in response to specific events. Used to model the entire lifecycle of an object. |
| Use Case Diagram | Shows what functions the system provides from the user's (actor's) perspective. Often used in the early stages to define the system's scope and identify requirements. |

3. The System's Goals: Requirement and Parametric Diagrams ✅
Finally, these diagrams clarify the conditions and constraints that the system must satisfy.
- Requirement Diagram: Displays the functional and non-functional requirements that the system must meet in a hierarchical structure, and allows for tracing relationships with other model elements (which design element satisfies which requirement).
- Parametric Diagram: Expresses constraints related to system performance, safety, etc., using mathematical formulas or rules. It's mainly used for system analysis and verification.

SysML Diagrams at a Glance
Frequently Asked Questions ❓
How was it? Are you feeling a bit more familiar with SysML diagrams now? Once you understand the purpose and role of each diagram, you can view complex systems in a much more systematic way. If you have any more questions, feel free to ask in the comments! 😊
This article is a re-reation of the core content of the article I wrote last year using AI. If you are interested in the original article, please refer to the HTML below!